
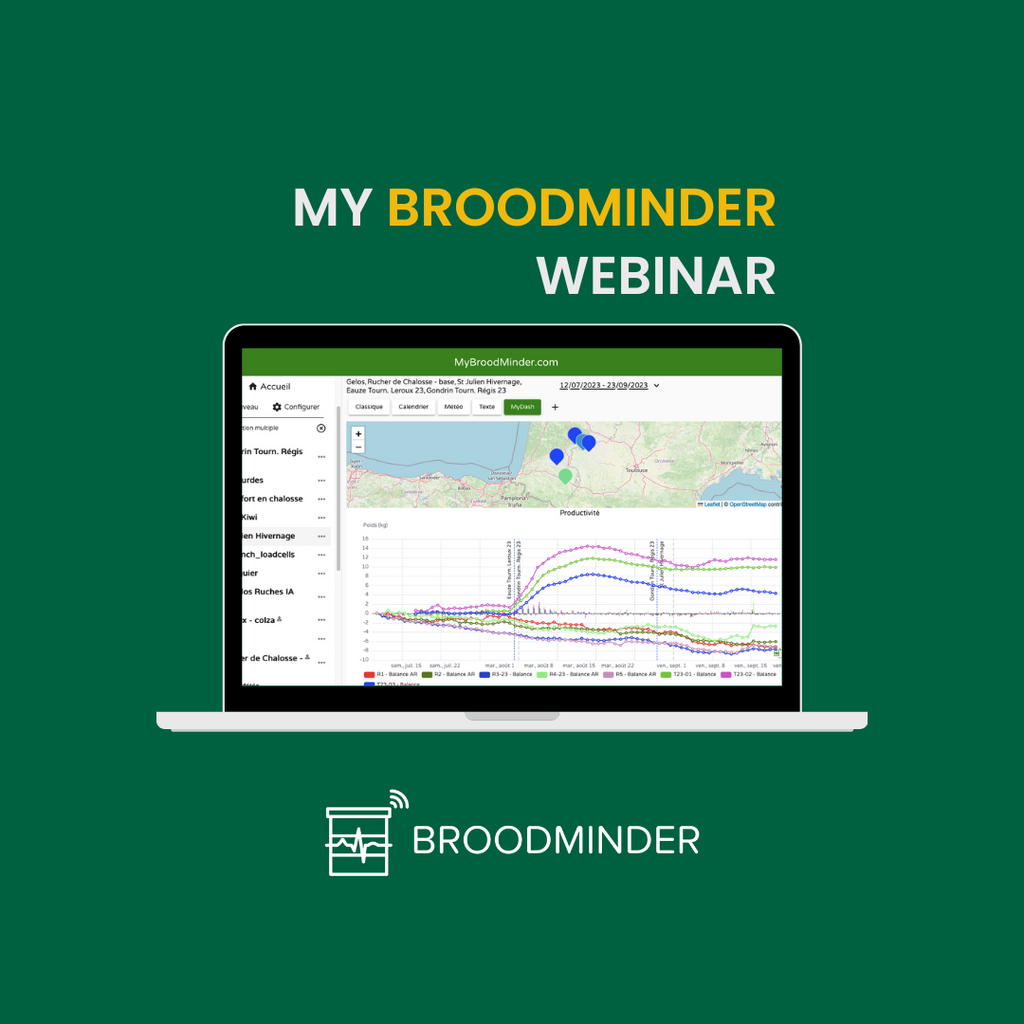
BroodMinder unique data solutions for Pro and Migratory beekeepers
We know how hard is doing beekeeping for business and how much it has changed -and keeps changing- over the last decades. At BroodMinder we wish to make it easier for professional and migratory beekeepers. Our tools provide real-time input for an informed decision-making. They are an asset for any beekeeper willing to improve bussiness operations while taking better care of their bees.
Start with the right hardware set-up
In this post we will go through the BroodMinder toolbox : tools that process raw data to transform it into beekeeper actionable information. For sure, part of this data is harvested directly in the apiary through several devices (scales, inner sensors, weather station...). The hardware setup is therefore important for what will follow. To help you making choices, we have pre-packaged a series of Professional Kits. You can also learn through a few use cases in How to setup apiary monitoring for professional beekeepers.

The BroodMinder system is highly modular. The idea is far from putting a scale under each hive but also from having a single scale in the apiary! If you keep reading, you will find that there are smarter set-ups delivering great insight with a marginal extra cost.
What data will you get, and how can you use it?
Let's discover Broodminder toolbox!
1. Monitoring hive weight and Productivity
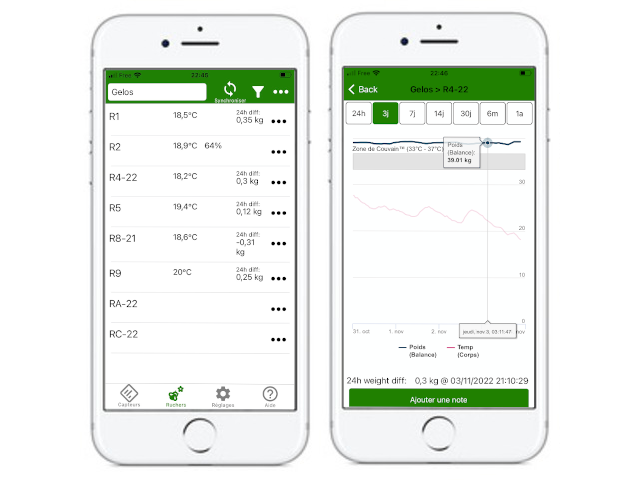
With BroodMinder hive scales, you can continuously keep track of colony weight. By default, you’re getting a new weight measurement every hour (you can set it to 5 and 30 minutes if you wish). Our tools are then processing those raw measurements computing daily weight gain and also daily bees Productivity (bees' work of the day). Note that Productivity is the only parameter that allows you to compare hives among them. We make it easy for you to display multiple hives/apiaries on the same graph to assess their performance.

However, we know that on hectic days you won’t have time to reach your PC. That’s why we are also reporting the essential information in real time within Broodminder-Bees App. With a quick sight you notice hive total weight and last 24h variation (updated hourly). And if you wish more detail the weight graph is at one tap of your finger.
Weight is an essential component of hive monitoring. It can help you in remote decision making: for example, deciding if you should double the hive under intense nectar-flows or if on the contrary, bees are asking for feeding when things don't go as expected.
However, multiple times we have confirmed that basing your decision making on a single scale is risky. You rely on a unique hive behavior. Was it a stronger, medium or weak hive? How has it evolved since the last time you inspected? Sometimes you do not know, and the consequence might be that you are you under-estimating or over estimating the nectar flow?
Clearly, you should have extra input to reduce that risk. Does it mean adding another scale? Ideally yes, but maybe your financial officer says no. Fortunately there are other options at a marginal cost. And this is where brood and internal sensors enter into scene.
2. Monitoring brood development
Many actions in your apiary are related to monitoring and managing the brood level. A BroodMinder-T associated with BroodMinder algorithms inform you at any time about the brood level in each colony and its' evolution. This way, you can make the right decisions remotely and avoid unnecessary and intrusive inspections.
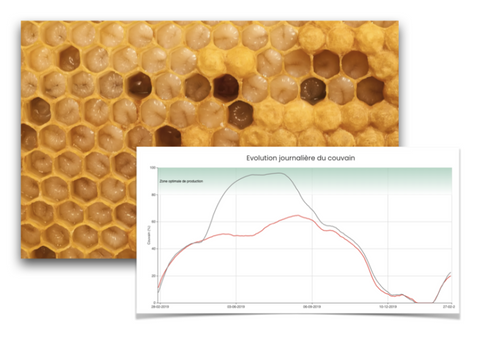
Brood level is a measure of colony “force” and as you know, the productivity is strongly corelated with colony force. You should always consider introduce an internal sensor on hives equipped with scales. Prior to analyzing weight, you must check brood level. If brood is okay, productivity is reliable. If there’s some unexpected event, you know that productivity might be misleading.
Let me say this again: Prior to analyzing weight, you must check brood level. This is a key take away not to forget. It’s very important.
Pushing that best practice further, my preferred setup is having hive #1 fully equipped (weight+brood) and hives #2 and #3 only with brood. The way it goes then is that you check brood on the 3 hives and then weight on hive #1. Now you’re able to place the weight variations you’ve seen in a larger context: if brood in hive #1 is below brood in hives #2 and #3 it means your productivity measurement is underestimated. If on the contrary it is higher, you overestimate.
This setup with 4 devices is much more robust than a single scale and comes at a marginal cost of about hundred euros.
3. Forage and Nectar-flow indexes
Until here we’ve seen hive weight and internal temperature as raw measurements that are transformed into beekeeper indicators: gain, productivity and brood that allow to compare hives one each other. Those metrics are directly measured in the apiary and give you a real time status of what’s going on now and over the last period. However, to improve your decision-making you will need more anticipation. You need a forecasting tool!
Forage and Nectar-flow Indexes ® are designed for forecasting: We want to shed light on the way ahead. 10 days ahead taking advantage of the weather forecasting service from WeatherSource that is fully integrated within BroodMinder.
Let’s see now how those tools work:
First of all you have to set the apiary local temperature/humidity source. It can be a scale or better a Weather station or a Weather hub. This will deliver real time local temperature and humidity. And it will overlay on the same graph with the WeatherSource weather model. On the graph below we see that Local (dark green) and WeatherSource (light green) are in an excellent correlation for temperature and humidity which is a confirmation we can rely on the weather service in that particular apiary.
The weather service also delivers rain and wind which our weather station is not (yet) able to deliver. But moreover, what the weather service is also delivering is a 10-day forecast. The figure below what taken on Nov 24th. Forecast starts from the dashed line up to Dec 03.

Having this forecast is extremely helpful because you will be able to assess what will happen. And to make it easier to you, we wrap all this bunch of data into two simple metrics: the Forage index and the Nectar-flow index.
Forage index deals with bees and the suitability of ambient conditions for them to fly and work outside. On a single sight you can identify hectic periods from more quiet moments.

Nectar-flow Index is more related with plants and bloom. This tool evaluates whether the ambient conditions are suitable for nectar flow. This is a good indicator of how things are showing up and allows for a projection over the next period. This may end up being one major tool for your scheduling.
4. Wrapping it all together to achieve maximum insight
Now that we have seen all those tools, how do they interact together? Well, you will work them out following the next method:
- First check brood to verify force on your hives.
- Second check weight and asses how the nectar flow is progressing. You can compare past productivity with past nectar flow indexes. This will give you a good status.
- Third it is about forecasting what is expected to happen. Check future nectar flow indexes and compare them to the past ones. You also may know about flower potential and putting it all together you will end up with a very good assessment of what may happen in the next few days.
Let’s take a moment to go through an example. Below is a chart of sun flower nectar-flow in summer 2021. It is issued from the post Methods for evaluating sunflower nectar-flow. This graph shows the full history, but let’s assume you check your apiary on the July 22st. This means brood and productivity data stop that day (dark dashed line).

Now, what’s happening in this particular situation?
First of all, we note that brood levels are different. The first day green > yellow > blue. But whatever their strength, Productivity has been null until 14/07. Weather conditions were the cause, which is also well described by very low nectar-flow index.Hopefully the nectar-flow arrived from 15/07 ahead and with no surprise, green performed better than yellow and blue was falling behind.
Here is another interesting thing: From the 17/07 we note that green hive loses brood and yellow raises over. This is directly transcribed on productivity. Yellow is now producing more!
Now, what will happen over the next days, past July 21?
Nectar-index says that the current level at 60% will maintain one more day and then reduce to 30%. Therefore, we can forecast that productivity slope will then flatten but keep going, most probably until the end of the nectar-flow which will finally happen on 28/07.
Last but not least, you will be able to make the balance once the migration is over. What happened actually? How was the forecast? Which are the critical nectar flow indexes? We know that rapeseed produces nectar at much lower index than sunflower for example.
With your experience and over the seasons you will learn which threshold is important and use them at your advantage on the next period.
Until here we have seen how to take advantage of the BroodMinder toolbox to monitor Productivity and nectar-flows. But there’s more than productivity in beekeeping. What advantages can you draw on other periods of the year? If you’re interested in knowing more, keep reading.
5. Alert system
An example for this are the high (over heating) and lower temperature thresholds. If your hives are stressing in summer (exposed to full sun) or in winter (too low insulation) you will know it.

There's already a long list of beekeepers that discovered with this tool how stressed their hives might be in a given yard and took action to mitigate the effects.
Alerts are delivered within a daily email report.
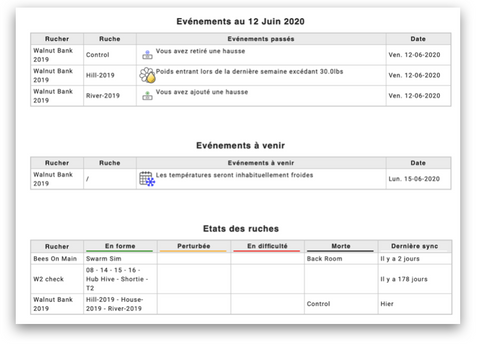
And also, within the apps. Alerts are displayed on context, over the brood and productivity curves so that you notice what happened, when and the consequences. In the example below, this hive was constantly overheating, and experience a deep brood reduction over the period.

6. Detect brood-less periods for a just-in-time anti-mite treatment
Automatic brood monitoring (ie. measuring inner temperature) is a great tool to detect brood-less periods. This moment of the year (if it actually happens) is not always easy to find through a classical approach. You don’t want to inspect hives in November and Queen bee might have different plans of what you believe. This is more and more often the case with global warming. Brood-less periods are no more at a fixed date in the year.

With the same tool, we have also seen queens starting to lay in December, when no one would expect this behavior. And moreover, keep lying in January and February, even under harsh ambient conditions (crazy or hero queens, you decide). Having this first-hand information is critical for you to know. First because your mite treatment will need to be adapted. A hive lying since December has produced much more mites in April than one lying since February. You want to know that.
7. Seamless tools
We know you’re on the field most of the day and that you’re far from a PC to check the data. That’s why the App BroodMinder Bees is there, to deliver the information wherever you are. Currently in Bees App you can manage devices, take inspection notes and of course view weight and temperature graphs. You can of course, sync the devices and collect data in your yard, even in off-line mode.Multitenancy is also a feature we believe important. If you are working in a group, you can use BroodMinder Bees on your phone and any action you or your colleagues take on it will be automatically available to the others.
In the coming months we want to bring more metrics to the BroodMinder Bees : productivity, brood, indexes... We want to deliver you the most complete information wherever you are. Because, maybe, the most suitable moment to assess your hives is in the passenger seat of your truck while you’re moving from Yard A to Yard B.

8. What other tools are available?
We keep learning and adding new features over the seasons. Our customers are also a great source of valuable input and help us improve our existing and future tools. In the ongoing pipeline there’s more work on predicting nectar flows and also blooming. This might be one of the future tools in MyBroodMinder. Stay Tuned!
Funding your investment
The European Commission supports the beekeeping sector through its Common Agricultural Policy (CAP).
If you are a beekeeper in member country, you should be able to access that funding. Check it from your local government.


